搜索

查看: 3206|回复: 11

[JavaScript] Echarts自定义图形的方法参考

[复制链接]
发表于 2023-5-4 11:49:31 | 显示全部楼层 |阅读模式
Editor 2023-5-4 11:49:31 3206 11 看全部
目录
  • 前言
  • 1.自定义图形最后的效果是这样的:
  • 2.注册自定义的图形
  • 3.extendShape
  • 4.使用echarts注册这三个图形
  • 5.使用自定义的形状
  • 总结
    前言
    在一个前端大屏项目中,有一个模块使用到了自定义的,由三个面组成的伪3D柱形图。在此处记录一下,方便后续自定义的时候参考一下。涉及到了zrender里面的一些方法,还特意去zrender看了些示例和文档。

    1.自定义图形最后的效果是这样的:

    2023022309485515.png

    Echarts自定义图形的方法参考9125 作者:Editor 帖子ID:2745 论坛知鸟论坛_zn60.com


    图形由三个面组成,需要定义三个形状。用cubeleft,cubetop,cuberight来分别定义左侧面,顶部面以及右侧面。

    2.注册自定义的图形
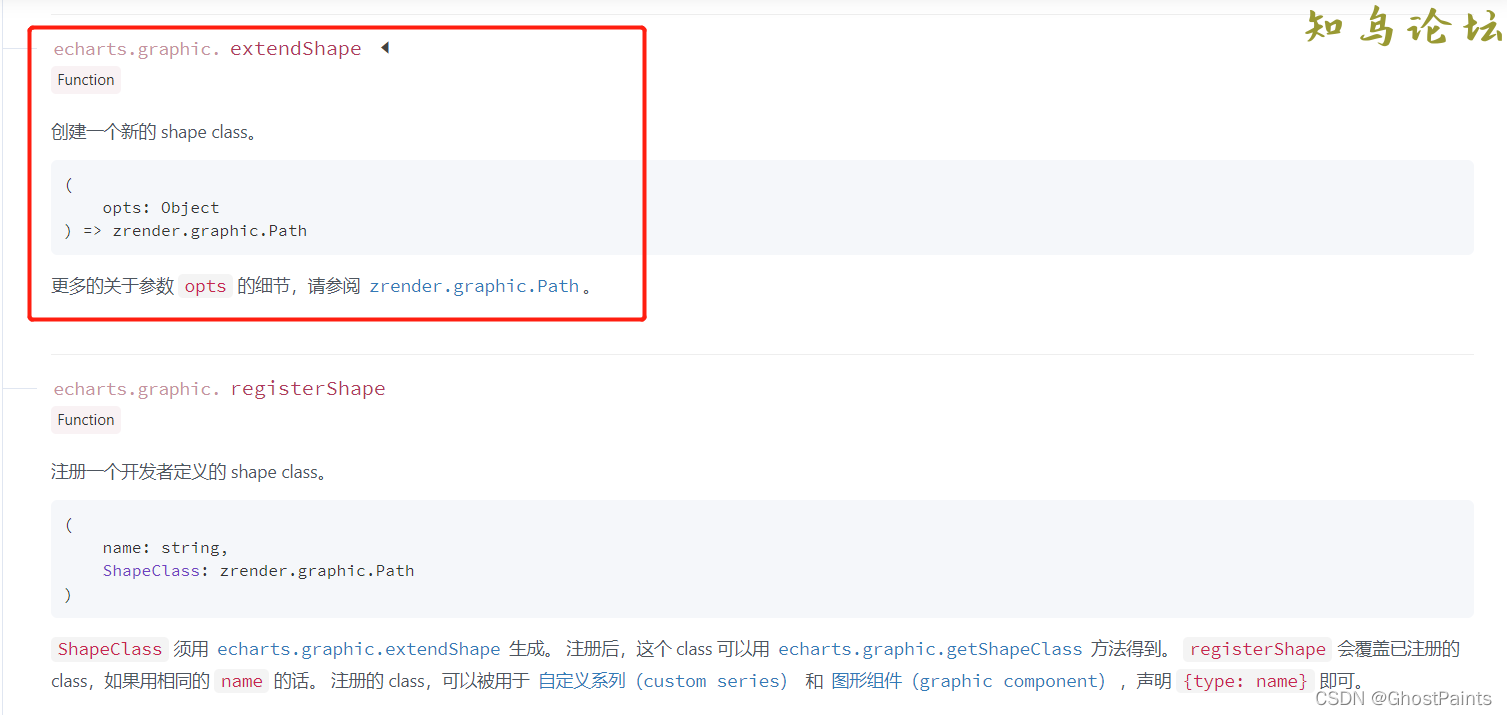
    echarts官方文档处:Documentation - Apache ECharts

    2023022309485516.png
    Echarts自定义图形的方法参考2283 作者:Editor 帖子ID:2745 论坛知鸟论坛_zn60.com


    我们需要定义一个这样的类,然后再通过echarts来注册这个类,后续就可以通过类名来使用了。

    3.extendShape
                // 绘制左侧面
                const CubeLeft = echarts.graphic.extendShape({
                        shape: {
                            x: 0,
                            y: 0
                        },
                        buildPath: function(ctx, shape) {
                            const xAxisPoint = shape.xAxisPoint
                            const c0 = [shape.x, shape.y]
                            const c1 = [shape.x - 13, shape.y - 13]
                            const c2 = [xAxisPoint[0] - 13, xAxisPoint[1] - 13]
                            const c3 = [xAxisPoint[0], xAxisPoint[1]]
                            ctx.moveTo(c0[0], c0[1]).lineTo(c1[0], c1[1]).lineTo(c2[0], c2[1]).lineTo(c3[0], c3[1]).closePath()
                        }
                 })
                // 绘制右侧面
                const CubeRight = echarts.graphic.extendShape({
                        shape: {
                            x: 0,
                            y: 0
                        },
                        buildPath: function(ctx, shape) {
                            const xAxisPoint = shape.xAxisPoint
                            const c1 = [shape.x, shape.y]
                            const c2 = [xAxisPoint[0], xAxisPoint[1]]
                            const c3 = [xAxisPoint[0] + 18, xAxisPoint[1] - 9]
                            const c4 = [shape.x + 18, shape.y - 9]
                            ctx.moveTo(c1[0], c1[1]).lineTo(c2[0], c2[1]).lineTo(c3[0], c3[1]).lineTo(c4[0], c4[1]).closePath()
                        }
                    })
                // 绘制顶面
                const CubeTop = echarts.graphic.extendShape({
                        shape: {
                            x: 0,
                            y: 0
                        },
                        buildPath: function(ctx, shape) {
                            const c1 = [shape.x, shape.y]
                            const c2 = [shape.x + 18, shape.y - 9]
                            const c3 = [shape.x + 5, shape.y - 22]
                            const c4 = [shape.x - 13, shape.y - 13]
                            ctx.moveTo(c1[0], c1[1]).lineTo(c2[0], c2[1]).lineTo(c3[0], c3[1]).lineTo(c4[0], c4[1]).closePath()
                        }
                 })
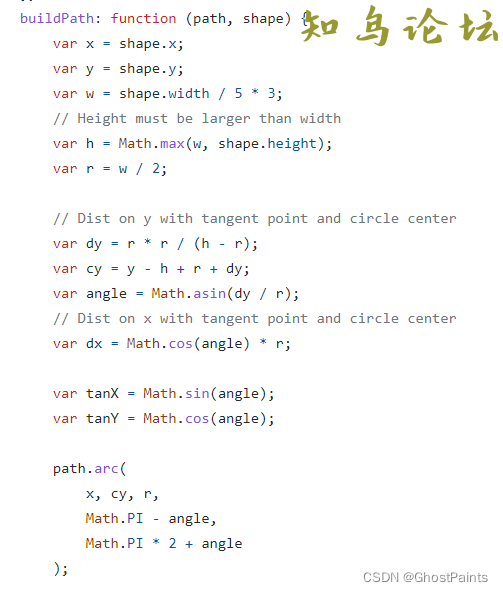
    这段代码主要是看buildpath如何使用,zrender的官方文档中,并没有直接告诉这个方法的两个参数是干什么用的,只给了一个示例,从这个示例中,可以知道这两个参数具体怎么用。
    示例网址:https://github.com/ecomfe/zrender/blob/master/test/pin.html

    2023022309485518.png
    Echarts自定义图形的方法参考1367 作者:Editor 帖子ID:2745 论坛知鸟论坛_zn60.com


    第一个参数是path,第二参数是shape。path可以理解为一个canvas中的绘制画笔,可以设置路径并且闭合路径。
    第二个参数在echarts中,是自定义的custom传递过来的,因此可以通过这个对象获取到我们一个很熟悉的属性 xAxisPoint。
    绘制的两个面中,只有左侧和右侧面需要有填充高度,顶部不需要,所以顶部的形状就没有使用xAxisPoint这个属性。
    这也是很好理解的,因为我们自定义的伪圆柱体里面的填充物肯定是有一个高度的。填充多少根据我们的数据来知道,让它看起来确实是被某种东西从底部开始增多填充了。
    拿比较简单的顶部来举例:
    buildPath: function(ctx, shape) {
        const c1 = [shape.x, shape.y]
        const c2 = [shape.x + 18, shape.y - 9]
        const c3 = [shape.x + 5, shape.y - 22]
        const c4 = [shape.x - 13, shape.y - 13]
        ctx.moveTo(c1[0], c1[1]).lineTo(c2[0], c2[1]).lineTo(c3[0], c3[1]).lineTo(c4[0],c4[1]).closePath()
    }
    绘制的四边形,其实就是四个顶点,我们只需要用moveTo来控制路径就行,在最后那个点进行闭合就行。偏移量是固定的值,可以根据情况自己去设置不同的值来扭曲这个四边形。
    其中c1是底部的顶点,c2是右侧的顶点,c3是顶部的顶点,c4是右侧的顶点。其他两个面也是类似的。

    4.使用echarts注册这三个图形
                    // 注册三个面图形
                echarts.graphic.registerShape('CubeLeft', CubeLeft)
                echarts.graphic.registerShape('CubeRight', CubeRight)
                echarts.graphic.registerShape('CubeTop', CubeTop)
    5.使用自定义的形状
    其他的数据都和正常使用echarts一样,不同的地方在于series的配置。
    series数组中,总共放置二个对象。第一个对象如下:
    {
                    type: 'custom',
                    renderItem: function(params, api) {
                        const location = api.coord([api.value(0), api.value(1)])
                        return {
                            type: 'group',
                            children: [{
                                type: 'CubeLeft',
                                shape: {
                                    api,
                                    x: location[0],
                                    y: location[1],
                                    xAxisPoint: api.coord([api.value(0), 0])
                                },
                                style: {
                                    fill: 'rgba(47,102,192,.27)',
                                    stroke: 'black'
                                },
                                z2: 999
                            }, {
                                type: 'CubeRight',
                                shape: {
                                    api,
                                    x: location[0],
                                    y: location[1],
                                    xAxisPoint: api.coord([api.value(0), 0])
                                },
                                style: {
                                    fill: 'rgba(59,128,226,.27)',
                                    stroke: 'black'
                                },
                                z2: 999
                            }, {
                                type: 'CubeTop',
                                shape: {
                                    api,
                                    x: location[0],
                                    y: location[1],
                                    xAxisPoint: api.coord([api.value(0), 0])
                                },
                                style: {
                                    fill: 'rgba(72,156,221,.27)',
                                    stroke: 'black'
                                },
                                z2: 999
                            }]
                        }
                    },
                    data: MAX
    }
    最主要的还是renderItem里面的逻辑,这个方法返回一个对象,对象就是我们自定义的一个group组。renderItem可以返回的对象在文档中都有说明:Documentation - Apache ECharts
    我们定义的那三个面,需要把它看成一个整体,所以renderItem返回的是一个类型为group的对象,另外三个形状作为children保存在数组中。
    其中的shape参数,会在buildpath中使用到。
    style中设置了它的填充颜色和边框线颜色。然后使用z2定义这个echarts的显示层级为最上级。如果不使用它,下面用于填充的会将其遮挡住。
    这里也只是定义了第一个自定义的形状,也就是最外层的那个伪3d柱体。第二个自定义形状是要填充的形状。
    {
                    type: 'custom',
                    renderItem: (params, api) => {
                        const location = api.coord([api.value(0), api.value(1)])
                        var color = new echarts.graphic.LinearGradient(
                            0, 0, 0, 1, [{
                                    offset: 1,
                                    color: "#FEFD53"
                                },
                                {
                                    offset: 0,
                                    color: "#f7c824"
                                }
                            ]
                        );
                        return {
                            type: 'group',
                            children: [{
                                type: 'CubeLeft',
                                shape: {
                                    api,
                                    xValue: api.value(0),
                                    yValue: api.value(1),
                                    x: location[0],
                                    y: location[1],
                                    xAxisPoint: api.coord([api.value(0), 0])
                                },
                                style: {
                                    fill: color,
                                    stroke: 'red'
                                }
                            }, {
                                type: 'CubeRight',
                                shape: {
                                    api,
                                    xValue: api.value(0),
                                    yValue: api.value(1),
                                    x: location[0],
                                    y: location[1],
                                    xAxisPoint: api.coord([api.value(0), 0])
                                },
                                style: {
                                    fill: color,
                                    stroke: 'red'
                                }
                            }, {
                                type: 'CubeTop',
                                shape: {
                                    api,
                                    xValue: api.value(0),
                                    yValue: api.value(1),
                                    x: location[0],
                                    y: location[1],
                                    xAxisPoint: api.coord([api.value(0), 0])
                                },
                                style: {
                                    fill: color,
                                    stroke: 'red'
                                }
                            }]
                        }
                    },
                    data: VALUE
    }
    内部填充的图形,使用了一个线性渐变的颜色用来填充。边框线使用红色。与第一个不同的是,style里面的风格,以及data使用的数据。这里的data使用value具体的数值。而外壳的图形使用的数据是max最大值。这样就会有一个渐变颜色填充的红色边框图形,填充到了一个黑色边框的柱体中。
    这样就自定义好了一个视觉上的3d柱体形状的图表了。

    总结
    到此这篇关于Echarts自定义图形的文章就介绍到这了,更多相关Echarts自定义图形内容请搜索知鸟论坛以前的文章或继续浏览下面的相关文章希望大家以后多多支持知鸟论坛!
  • 发表于 2023-6-28 18:59:41 | 显示全部楼层
    井底燕雀傥 2023-6-28 18:59:41 看全部
    楼主太厉害了!楼主,I*老*虎*U!我觉得知鸟论坛真是个好地方!
    发表于 2023-6-28 20:16:55 | 显示全部楼层
    123456868 2023-6-28 20:16:55 看全部
    既然你诚信诚意的推荐了,那我就勉为其难的看看吧!知鸟论坛不走平凡路。
    发表于 2023-6-29 18:23:41 | 显示全部楼层
    幸福341 2023-6-29 18:23:41 看全部
    这个帖子不回对不起自己!我想我是一天也不能离开知鸟论坛
    发表于 2023-6-29 18:54:23 | 显示全部楼层
    啤酒瓶空了缓 2023-6-29 18:54:23 看全部
    楼主,大恩不言谢了!知鸟论坛是最棒的!
    发表于 2023-6-29 20:35:21 | 显示全部楼层
    落败的青春阳落s 2023-6-29 20:35:21 看全部
    楼主太厉害了!楼主,I*老*虎*U!我觉得知鸟论坛真是个好地方!
    发表于 2023-6-30 11:53:10 | 显示全部楼层
    六翼天使494 2023-6-30 11:53:10 看全部
    既然你诚信诚意的推荐了,那我就勉为其难的看看吧!知鸟论坛不走平凡路。
    发表于 2023-6-30 12:13:48 | 显示全部楼层
    小妖花满楼满fx 2023-6-30 12:13:48 看全部
    我看不错噢 谢谢楼主!知鸟论坛越来越好!
    发表于 2023-6-30 12:22:29 | 显示全部楼层
    普通人物怨 2023-6-30 12:22:29 看全部
    楼主太厉害了!楼主,I*老*虎*U!我觉得知鸟论坛真是个好地方!
    发表于 2023-6-30 15:54:50 | 显示全部楼层
    术数古籍专卖疤 2023-6-30 15:54:50 看全部
    感谢楼主的无私分享!要想知鸟论坛好 就靠你我他
    • 您可能感兴趣
    您需要登录后才可以回帖 登录 | 立即注册

    本版积分规则 返回列表

    RSS订阅| 小黑屋| 知鸟论坛 |网站地图
    本站资源来自互联网用户收集发布,如有侵权请邮件联系处理。 联系邮箱E-mail:zniao@foxmail.com
    快速回复 返回顶部 返回列表